

Warehouse Productivity Metrics: What to Track Without Creating Bad Behaviour
Warehouse productivity metrics help fulfilment teams understand how effectively warehouse labour, processes, space and systems are being used. They can show whether the team is picking, packing, replenishing and dispatching work efficiently.
But productivity metrics need to be used carefully. If the business only measures speed, teams may unintentionally create more errors, rework, returns and customer complaints.
This guide explains the most useful warehouse productivity metrics for Ops Directors, COOs and Warehouse Managers — and how to track them without encouraging the wrong behaviours.
What Are Warehouse Productivity Metrics?
Warehouse productivity metrics measure how efficiently warehouse work is completed.
They usually focus on labour output, task completion, order flow, picking speed, packing speed, accuracy, capacity and cost.
In simple terms, warehouse productivity metrics answer this question: how much useful warehouse work are we completing, and at what level of quality?
These metrics should sit alongside wider fulfilment KPIs, because warehouse productivity affects dispatch performance, order accuracy, backlog, labour cost and customer experience.
Why Warehouse Productivity Metrics Matter
Warehouse productivity matters because labour is often one of the largest fulfilment costs.
If productivity is low, the business may need more people, more overtime, more temporary labour or more warehouse space just to maintain the same output.
Good productivity metrics help teams:
- Understand labour efficiency
- Identify picking or packing bottlenecks
- Reduce fulfilment cost per order
- Improve dispatch performance
- Plan peak season labour
- Balance speed and accuracy
- Spot training or process issues
- Make better decisions about systems and automation
Warehouse productivity is not about pushing people harder. It is about designing the operation so good work can happen consistently.
The Risk of Measuring Productivity Badly
Productivity metrics can create bad behaviour if they are used without context.
For example, if pickers are measured only on lines picked per hour, they may move faster but make more mistakes. If packers are measured only on orders packed per hour, they may rush checks and increase wrong-item shipments or damage claims.
Badly designed productivity metrics can lead to:
- Higher picking errors
- More packing mistakes
- Shortcuts around barcode scanning
- Ignored exception orders
- Poor stock movement discipline
- More rework
- Lower morale
- Misleading performance comparisons
The best productivity dashboards balance speed, accuracy, quality, cost and customer impact.
1. Orders Picked Per Hour
Orders picked per hour measures how many customer orders are picked within a given period.
This is useful for understanding picking throughput, especially in operations where most orders have a similar number of lines.
Formula:
Orders Picked Per Hour = Orders Picked ÷ Picking Hours
This metric is useful, but it can be misleading if order complexity varies significantly.
For example, picking 50 single-line ecommerce orders is very different from picking 50 complex multi-line wholesale orders.
Use this metric alongside lines picked per hour, units picked per hour and picking accuracy.
2. Lines Picked Per Hour
Lines picked per hour measures how many order lines are picked in a given period.
This is often more useful than orders picked per hour because it accounts for multi-line orders.
Formula:
Lines Picked Per Hour = Order Lines Picked ÷ Picking Hours
This metric helps teams understand picking productivity across different order profiles.
However, it should never be reviewed without accuracy. A higher pick rate is not a success if error rates rise at the same time.
Related guide: Pick Rate vs Pick Accuracy: Why Speed Alone Is a Dangerous KPI.
3. Units Picked Per Hour
Units picked per hour measures the number of individual units picked within a given time period.
This is useful where order lines may contain multiple units.
Formula:
Units Picked Per Hour = Units Picked ÷ Picking Hours
This metric is particularly useful for wholesale, B2B, replenishment and bulk-pick operations.
Again, context matters. Picking 100 small items is not the same as picking 100 bulky or fragile items.
4. Orders Packed Per Hour
Orders packed per hour measures packing bench throughput.
Formula:
Orders Packed Per Hour = Orders Packed ÷ Packing Hours
This helps identify whether packing capacity is keeping up with picking output.
If picking productivity is high but orders are building up before packing, the warehouse may have a packing bottleneck.
Related guide: How to Improve Packing Bench Efficiency.
5. Lines Packed Per Hour
Lines packed per hour measures packing productivity at a more detailed level than orders packed per hour.
It is useful when order complexity varies.
Formula:
Lines Packed Per Hour = Order Lines Packed ÷ Packing Hours
This helps compare packing workload more fairly across different order types.
For example, packing 40 single-line orders may be easier than packing 20 complex multi-line orders with fragile products, inserts, special checks or multiple parcels.
6. Pick Accuracy Rate
Pick accuracy rate measures how often warehouse teams pick the correct item and quantity.
Formula:
Pick Accuracy Rate = Accurate Picks ÷ Total Picks × 100
This metric is essential because productivity without accuracy creates rework.
A picker who works quickly but creates errors may appear productive on a speed dashboard while increasing total fulfilment cost.
For practical guidance, read: How to Improve Warehouse Picking Accuracy.
7. Order Accuracy Rate
Order accuracy rate measures whether customers receive the correct complete order.
This metric is broader than pick accuracy because it includes picking, packing and dispatch quality.
Formula:
Order Accuracy Rate = Accurate Orders ÷ Total Orders Shipped × 100
Order accuracy is one of the most important balancing metrics for warehouse productivity.
If productivity rises but order accuracy falls, the operation may be moving faster but performing worse.
Related guide: Order Accuracy Rate: Why It Matters and How to Improve It.
8. On-Time Dispatch Rate
On-time dispatch rate measures whether orders leave the warehouse within the expected dispatch window.
Formula:
On-Time Dispatch Rate = Orders Dispatched On Time ÷ Total Orders Due for Dispatch × 100
This is an important productivity outcome metric because it shows whether warehouse activity is supporting the customer promise.
High warehouse activity does not matter if orders still miss carrier cut-offs.
Related guide: On-Time Dispatch Rate: How to Measure and Improve It.
9. Labour Hours Per Order
Labour hours per order measures how much labour time is used to fulfil each order.
Formula:
Labour Hours Per Order = Total Fulfilment Labour Hours ÷ Orders Shipped
This helps operations leaders understand labour efficiency and fulfilment cost.
It is especially useful when comparing normal trading, peak periods, temporary labour and process changes.
However, this metric should be segmented by order type where possible. Complex B2B or wholesale orders may naturally require more labour than simple single-item ecommerce orders.
10. Orders Per Labour Hour
Orders per labour hour is the inverse of labour hours per order.
Formula:
Orders Per Labour Hour = Orders Shipped ÷ Total Fulfilment Labour Hours
This metric helps show how many orders the operation can process for each hour of labour used.
It is useful for capacity planning, labour scheduling and productivity trend tracking.
For deeper labour analysis, read: Labour Efficiency Metrics for Warehouse and Fulfilment Teams.
11. Rework Rate
Rework rate measures how often warehouse work needs to be corrected, repeated or manually fixed.
Rework may include:
- Repicking incorrect items
- Repacking orders
- Correcting labels
- Fixing stock movements
- Investigating failed picks
- Processing avoidable returns
- Handling replacement shipments
Rework is often hidden from basic productivity reporting. But it is one of the biggest reasons why operations feel busy without becoming more efficient.
A warehouse that reduces rework may improve productivity without asking people to work faster.
12. Failed Pick Rate
Failed pick rate measures how often pickers cannot complete a pick because the expected stock is not available or not where the system says it should be.
Formula:
Failed Pick Rate = Failed Picks ÷ Total Pick Attempts × 100
Failed picks reduce productivity because staff lose time searching, reporting issues, waiting for decisions or triggering exceptions.
Common causes include:
- Incorrect stock records
- Poor replenishment
- Wrong bin locations
- Damaged stock shown as available
- Unrecorded stock movement
- Returned stock not processed properly
Related guides:
- Inventory Accuracy: Why It Breaks and How to Fix It
- Stock Replenishment Best Practices for Fulfilment Teams
13. Backlog by Warehouse Stage
Backlog by warehouse stage shows where work is building up.
Useful views include:
- Orders waiting to pick
- Orders picked but not packed
- Orders packed but not dispatched
- Orders in exception queue
- Orders waiting for stock
- Orders close to carrier cut-off
This is one of the most useful productivity metrics because it shows where the warehouse is constrained.
For more detail, read: Backlog Metrics: How to Measure Fulfilment Risk Before Customers Complain.
14. Warehouse Walking Time
Walking time is a major hidden productivity drain.
If warehouse staff spend too much time walking between locations, the operation may need more labour than it should.
Walking time can be reduced through:
- Better warehouse layout
- Fast-mover placement
- Improved pick routes
- Batch or trolley picking
- Better replenishment
- Reduced congestion
Related guide: How to Reduce Warehouse Walking Time.
15. Productivity by Order Type
Warehouse productivity should be measured by order type where possible.
Useful categories include:
- Single-line orders
- Multi-line orders
- Wholesale orders
- B2B portal orders
- Marketplace orders
- International orders
- Bundles and kits
- High-value orders
- Orders requiring special packing
This prevents unfair comparisons and helps leaders understand which order types consume the most operational effort.
For example, a wholesale order may take longer than an ecommerce order but still be commercially valuable. Productivity should be interpreted in context.
16. Productivity by Channel
Different sales channels can create different warehouse workloads.
Track productivity by:
- Ecommerce website
- Marketplace
- Wholesale
- B2B portal
- EDI
- Retail replenishment
- Customer service replacement orders
This helps identify whether one channel is creating disproportionate workload, errors, split shipments, returns or exception handling.
Related guide: Multi-Channel Fulfilment for Growing Businesses.
Warehouse Productivity Metrics Example
| Metric | Example Value | What It Suggests |
|---|---|---|
| Lines picked per hour | 85 | Picking throughput |
| Pick accuracy rate | 99.2% | Picking quality |
| Orders packed per hour | 42 | Packing throughput |
| Picked but not packed backlog | 180 orders | Packing bottleneck likely |
| Failed pick rate | 3.5% | Stock accuracy or replenishment issue |
| On-time dispatch rate | 96.4% | Customer promise risk |
This kind of view is far more useful than looking only at pick rate or orders per hour.
Good vs Bad Warehouse Productivity Metrics
| Bad Metric Use | Better Approach |
|---|---|
| Only measure pick speed | Measure pick speed alongside pick accuracy and rework |
| Compare all pickers without order complexity | Segment by order type, zone, product type or task |
| Reward packing speed alone | Balance packing speed with order accuracy and damage rate |
| Ignore failed picks | Track failed picks as a stock and productivity issue |
| Only review daily totals | Track stage-level backlog and cut-off risk during the day |
| Use productivity metrics to blame individuals | Use metrics to improve process, training, layout and systems |
How to Avoid Bad Behaviour from Productivity Metrics
Warehouse metrics influence behaviour. If the wrong metric is rewarded, teams may optimise the wrong thing.
To avoid this:
- Always balance speed with accuracy
- Do not reward output if rework increases
- Segment by order complexity
- Review team performance, not just individual performance
- Include exception handling in productivity discussions
- Do not encourage staff to bypass scanning or checks
- Track customer-impact metrics as well as warehouse-output metrics
- Use metrics to identify process problems, not blame people
The best warehouse productivity culture improves process design, training, layout, systems and team rhythm — not just individual speed.
Warehouse Productivity and Peak Season
Peak season can distort productivity metrics.
During peak, order volumes rise, temporary staff may join, product mix may change, carrier cut-offs become tighter and backlog risk increases.
Before comparing peak productivity against normal trading, consider:
- Order mix
- Temporary staff productivity
- Training time
- Warehouse congestion
- Picking method changes
- Fast-moving SKU locations
- Packing bench capacity
- Carrier collection limits
Related guide: How to Manage Peak Season Fulfilment.
Warehouse Productivity Improvement Checklist
| Area | Action |
|---|---|
| Picking | Track orders, lines and units picked per hour alongside accuracy |
| Packing | Track orders and lines packed per hour alongside packing errors |
| Accuracy | Monitor pick accuracy and order accuracy as balancing metrics |
| Labour | Track orders per labour hour and labour hours per order |
| Rework | Measure repeat work, corrections, returns and replacement shipments |
| Stock | Track failed picks and replenishment-related delays |
| Backlog | Measure backlog by fulfilment stage and carrier cut-off risk |
| Segmentation | Review productivity by order type, channel and warehouse zone |
How Warehouse Productivity Connects to Other Metrics
Warehouse productivity should be viewed as part of the wider fulfilment performance picture.
- On-time dispatch rate — productivity must support dispatch promises
- Order accuracy rate — productivity should not come at the cost of errors
- Perfect order rate — speed and accuracy both affect customer experience
- Backlog metrics — backlog shows where productivity is not keeping up with demand
- Inventory accuracy metrics — stock issues reduce warehouse productivity
- Labour efficiency metrics — productivity directly affects labour cost
- Exception metrics — exceptions consume hidden operational time
This is why warehouse productivity should not be managed as a standalone number.
How Technology Helps Improve Warehouse Productivity
Technology helps improve warehouse productivity by giving teams better task control, visibility, validation and reporting.
A fulfilment platform can support:
- Digital pick lists
- Barcode scanning
- Pick route sequencing
- Batch, zone and wave picking
- Packing bench workflows
- Replenishment tasks
- Exception queues
- Backlog dashboards
- Warehouse productivity reporting
- Order and stock visibility
For a broader guide, read: What is Fulfilment Automation?.
How Modulus365 Helps Improve Warehouse Productivity
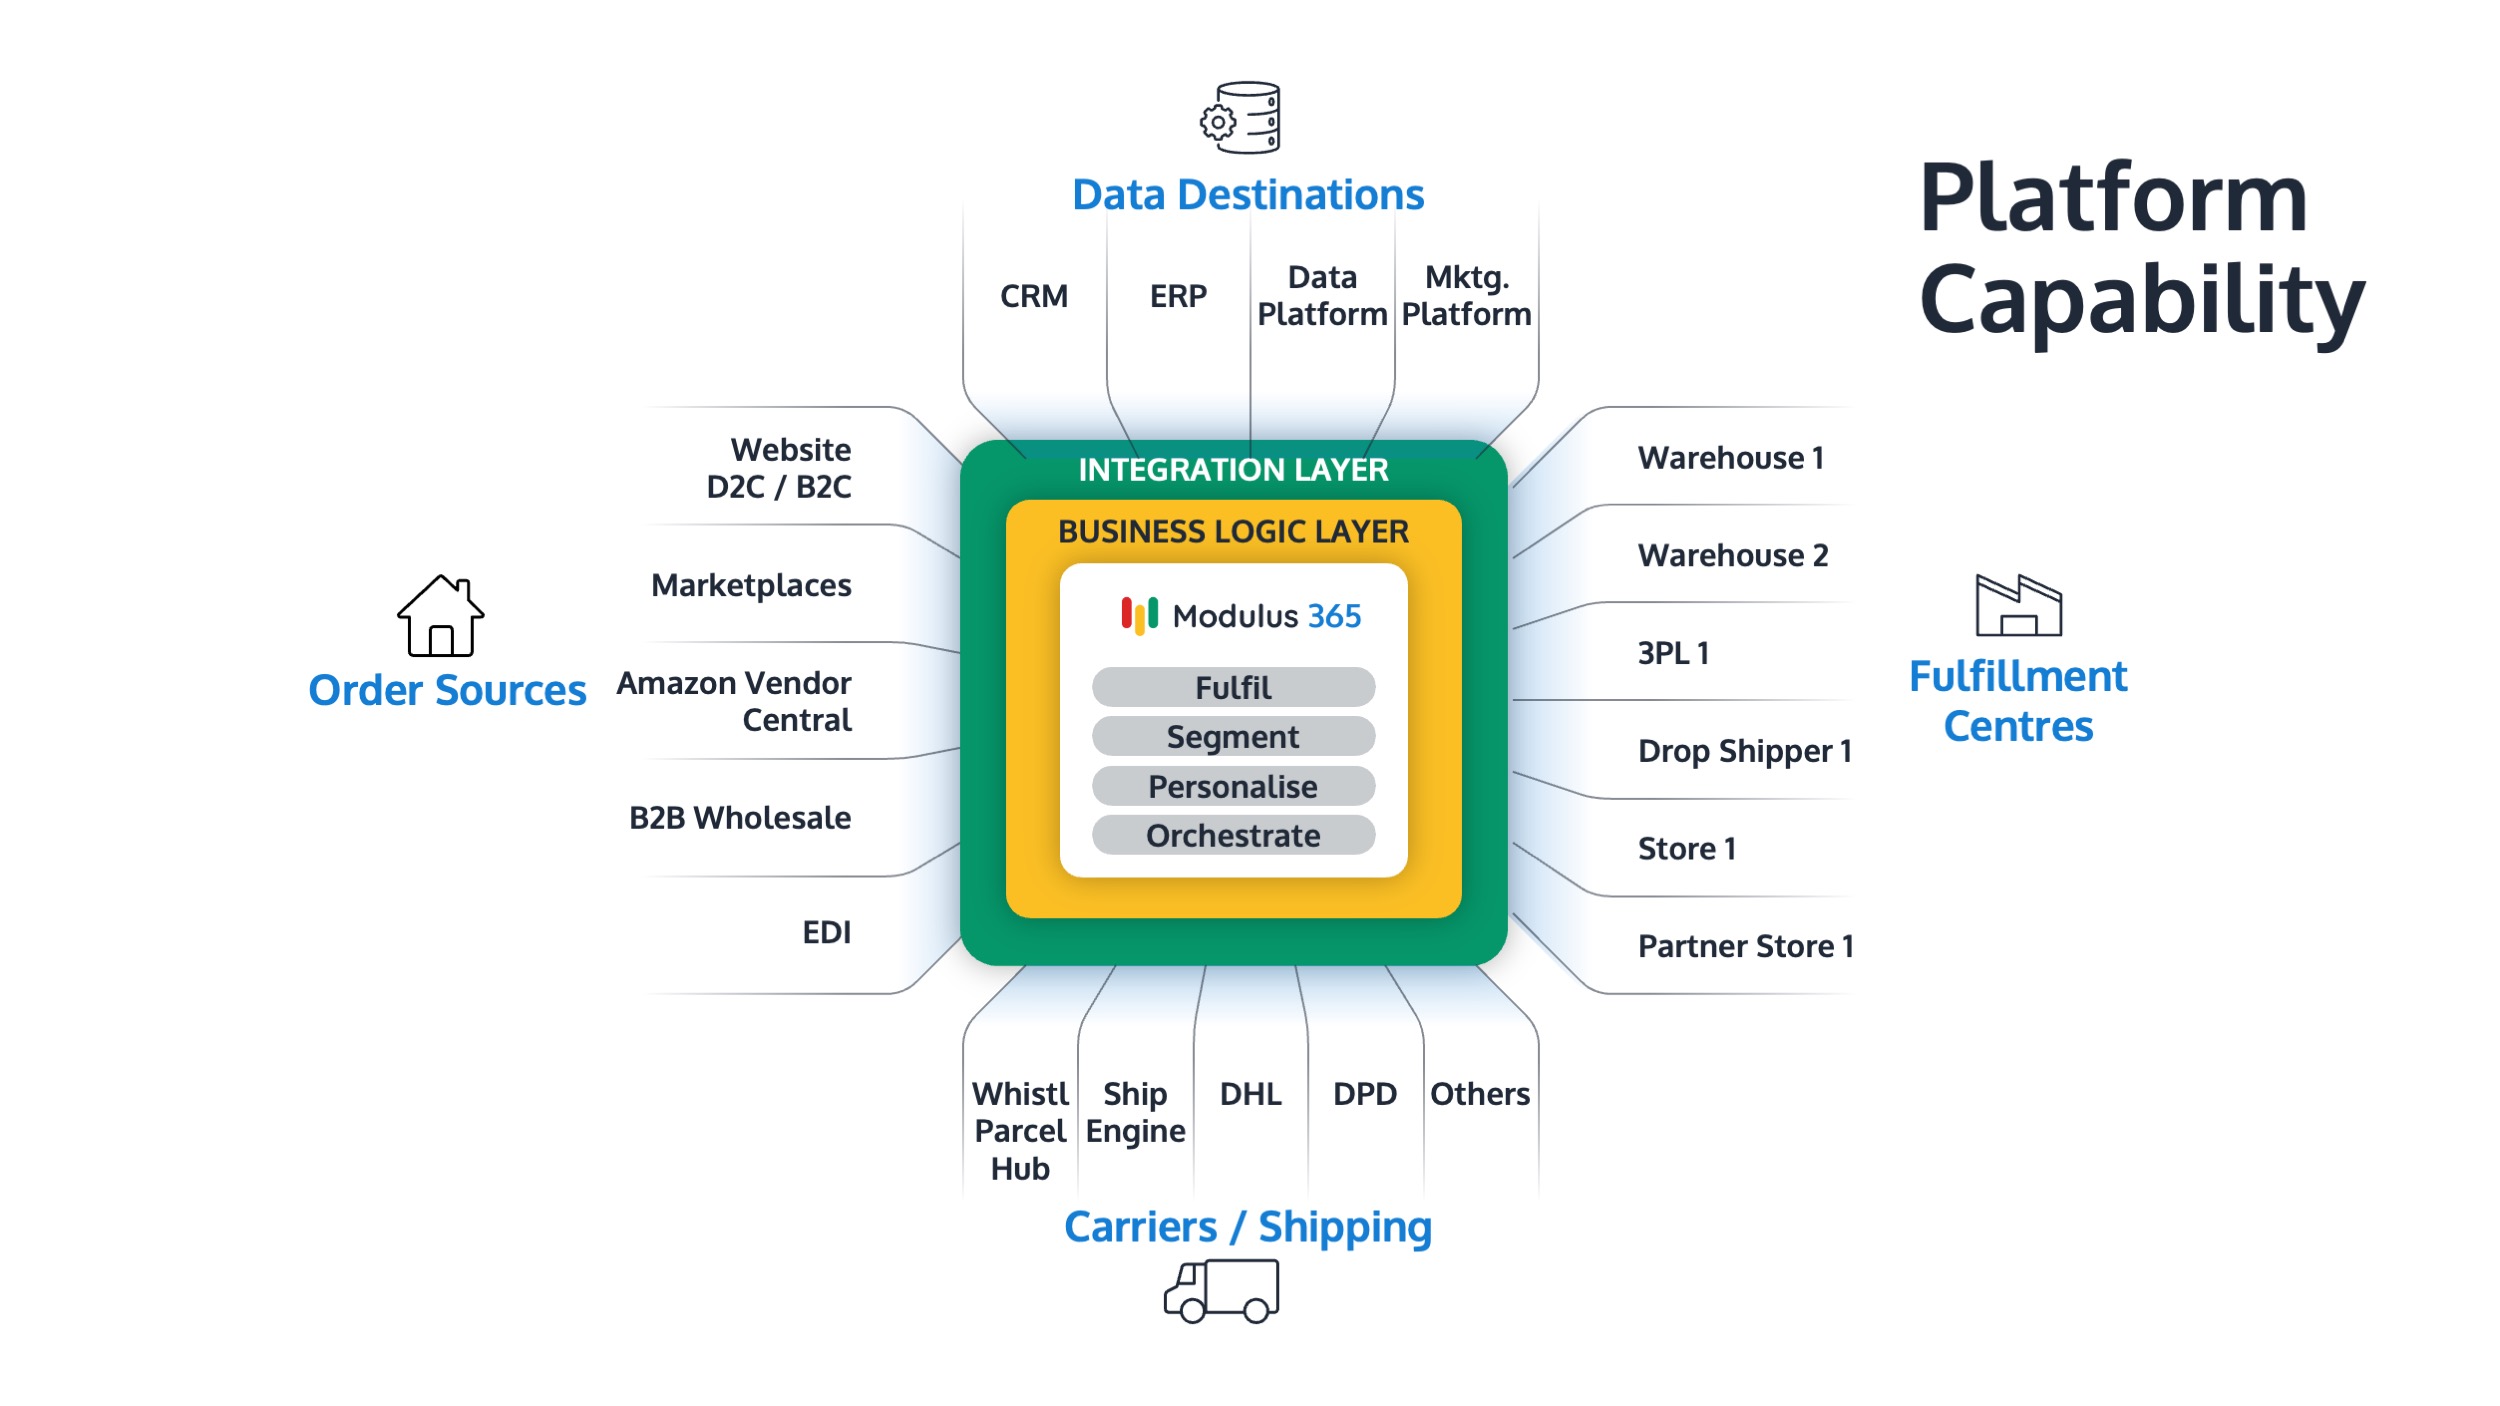
Modulus365 helps businesses connect order management, warehouse workflows, barcode scanning, inventory visibility, packing, carrier integration, exception handling and fulfilment reporting.
By giving operations teams clearer visibility of picking, packing, backlog, stock issues, order priority and dispatch status, Modulus365 helps businesses improve warehouse productivity without losing control of accuracy and customer experience.
For Sage businesses, Modulus365 can work alongside the ERP as the fulfilment operations layer.
👉 Learn more about Modulus365 for Sage.
Related FOA Guides
Warehouse productivity should be measured carefully so speed does not create errors, rework or poor customer experience. These guides explain the related metrics and operational levers:
- Pick Rate vs Pick Accuracy: Why Speed Alone Is a Dangerous KPI
- Order Accuracy Rate: Why It Matters and How to Improve It
- Labour Efficiency Metrics for Warehouse and Fulfilment Teams
- Backlog Metrics: How to Measure Fulfilment Risk Before Customers Complain
- How to Reduce Warehouse Walking Time
- Picking Methods Explained: Single, Batch, Zone and Wave Picking
- How to Improve Packing Bench Efficiency
- Barcode Scanning in Warehouse Operations
Ready to Improve Warehouse Productivity?
If warehouse productivity is difficult to measure, or speed improvements are creating errors, backlog or rework, Modulus365 can help bring better visibility and control into your fulfilment operation.
Frequently Asked Questions
What are warehouse productivity metrics?
Warehouse productivity metrics measure how efficiently warehouse work is completed, including picking, packing, labour use, order flow, accuracy, backlog and rework.
What warehouse productivity metrics should fulfilment teams track?
Fulfilment teams should track orders picked per hour, lines picked per hour, orders packed per hour, pick accuracy, order accuracy, labour hours per order, failed pick rate, backlog by stage and rework rate.
Why is pick rate alone a risky KPI?
Pick rate alone is risky because it measures speed without showing whether accuracy, rework, returns or customer complaints are getting worse.
How can warehouse productivity be improved?
Warehouse productivity can be improved through better layout, reduced walking time, clearer pick routes, barcode scanning, improved replenishment, better packing flow, stronger training and better task visibility.
How do you avoid bad behaviour from productivity metrics?
You avoid bad behaviour by balancing speed with accuracy, measuring rework, segmenting by order type, avoiding unfair comparisons and using metrics to improve processes rather than blame individuals.