

Inventory Accuracy Metrics: How to Know Whether You Can Trust Your Stock
Inventory accuracy is one of the most important foundations of fulfilment performance. If stock records cannot be trusted, everything else becomes harder: order allocation, picking, replenishment, dispatch, customer service, purchasing and demand planning.
For Ops Directors, COOs, Warehouse Managers and Inventory Managers, inventory accuracy metrics help answer a simple but critical question: can we trust what the system says we have?
This guide explains the key inventory accuracy metrics fulfilment teams should track, how to measure them, and how they connect to failed picks, overselling, stock discrepancies, backlog, warehouse productivity and customer experience.
What Are Inventory Accuracy Metrics?
Inventory accuracy metrics measure how closely system stock records match physical stock reality.
They help teams understand whether the business can trust stock quantities, stock locations, available stock, allocated stock and stock statuses.
In simple terms, inventory accuracy metrics answer these questions:
- Does the system stock match the physical stock?
- Is stock in the location where the system says it is?
- Is available stock genuinely available?
- Are discrepancies being found and fixed quickly?
- Are stock problems affecting fulfilment performance?
Inventory accuracy metrics should sit alongside wider fulfilment KPIs, because stock trust affects picking, dispatch, customer promise and fulfilment cost.
Why Inventory Accuracy Metrics Matter
Poor inventory accuracy creates problems across the whole fulfilment operation.
It can cause:
- Failed picks
- Overselling
- Unexpected stockouts
- Delayed orders
- Manual stock checks
- Emergency replenishment
- Unnecessary split shipments
- Customer service issues
- Manual stock adjustments
- Poor purchasing decisions
- Loss of trust in systems
When teams stop trusting inventory data, they often create manual workarounds. That may help temporarily, but it usually makes the operation slower and harder to scale.
Inventory Accuracy vs Stock Availability
Inventory accuracy and stock availability are related, but they are not the same.
| Area | Meaning | Question It Answers |
|---|---|---|
| Inventory accuracy | Whether stock records match physical reality | Can we trust the stock data? |
| Stock availability | Whether stock can be sold, allocated or fulfilled | Can we safely promise this stock? |
A warehouse may physically hold stock, but that stock may not be available if it is damaged, allocated, quarantined, returned but not inspected, or reserved for another customer or channel.
For a deeper guide, read: Available Stock vs Physical Stock vs Allocated Stock.
1. Inventory Accuracy Percentage
Inventory accuracy percentage is the headline stock accuracy metric.
It compares system stock records with counted physical stock.
Formula:
Inventory Accuracy % = Accurate Stock Records ÷ Total Stock Records Checked × 100
For example, if you check 1,000 SKU-location records and 960 match the system quantity, inventory accuracy is 96%.
This is useful as a headline metric, but it should not be used alone. A 96% result may hide serious issues if the inaccurate 4% includes fast-moving, high-value or customer-critical products.
2. Quantity Accuracy
Quantity accuracy measures whether the physical quantity of a product matches the system quantity.
For example, the system may show 50 units in a location, but the warehouse physically has 46 units.
Quantity accuracy helps identify issues such as:
- Unrecorded stock movements
- Picking errors
- Receiving errors
- Stock damage
- Unprocessed returns
- Manual adjustment problems
- Theft or shrinkage
Quantity accuracy is especially important for fast-moving products and products sold across multiple channels.
3. Location Accuracy
Location accuracy measures whether stock is physically stored where the system says it is.
A product may exist in the warehouse, but if it is not in the expected location, pickers may still fail to find it.
Example:
The system shows 20 units in location A-01-03, but the stock is physically in B-04-02. The total stock may be correct, but the location accuracy is wrong.
Location accuracy affects:
- Picking speed
- Failed pick rate
- Replenishment
- Cycle counting
- Warehouse productivity
- Stock confidence
Clear locations and scanning can help. Read: Barcode Scanning in Warehouse Operations.
4. Failed Pick Rate
Failed pick rate is one of the most useful operational indicators of inventory accuracy.
A failed pick happens when the system expects stock to be available, but the picker cannot complete the pick.
Formula:
Failed Pick Rate = Failed Picks ÷ Total Pick Attempts × 100
Failed picks may be caused by:
- Stock not physically present
- Stock in the wrong location
- Incorrect available stock
- Damaged stock shown as available
- Pick face not replenished
- Returned stock added back too early
- Unrecorded stock movements
Failed pick rate links directly to warehouse productivity metrics because every failed pick creates wasted time and follow-up work.
5. Cycle Count Variance
Cycle count variance measures the difference between expected stock and counted stock during regular stock checks.
Formula:
Cycle Count Variance = Counted Quantity – System Quantity
For example, if the system says 100 units and the count finds 94, the variance is -6 units.
Cycle count variance should be reviewed by:
- SKU
- Location
- Warehouse zone
- Product category
- Stock value
- Fast-moving products
- Reason code
Cycle counting is usually more useful than relying only on annual stock takes because it helps teams find issues throughout the year.
Related guide: Cycle Counting vs Annual Stock Takes.
6. Stock Adjustment Rate
Stock adjustment rate measures how often stock records are manually adjusted.
Some adjustments are normal, but frequent or unexplained adjustments are a warning sign.
Formula:
Stock Adjustment Rate = Stock Adjustments ÷ Total Stock Records or Transactions × 100
Track adjustments by:
- SKU
- Location
- User
- Reason code
- Quantity adjusted
- Stock value adjusted
- Positive vs negative adjustment
- Warehouse or site
High adjustment rates often indicate process weaknesses in receiving, putaway, picking, returns, replenishment or stock movement control.
7. Stock Adjustment Value
Stock adjustment count tells you how often adjustments happen. Stock adjustment value tells you the financial impact.
For example, 20 small adjustments on low-value products may matter less than 2 adjustments on expensive products.
Track:
- Total value adjusted
- Value adjusted by product category
- Value adjusted by warehouse
- Value adjusted by reason code
- High-value SKU discrepancies
This metric is especially useful for COOs, finance teams and inventory managers because it links stock control to margin and working capital.
8. Shrinkage Rate
Shrinkage measures stock loss that cannot be explained by normal sales, returns, transfers or recorded adjustments.
Formula:
Shrinkage Rate = Stock Loss Value ÷ Expected Stock Value × 100
Shrinkage may be caused by:
- Unrecorded damage
- Picking or packing errors
- Supplier shortages
- Receiving errors
- Theft
- Incorrect stock adjustments
- Process leakage
Shrinkage should be monitored carefully, but it should not automatically be treated as theft. In many fulfilment operations, shrinkage is often a symptom of weak process control.
9. Stockout Rate
Stockout rate measures how often products are unavailable when customers or operations need them.
In fulfilment, stockouts can create lost sales, back orders, split shipments, substitutions and customer complaints.
Track stockouts by:
- SKU
- Channel
- Warehouse
- Supplier
- Product category
- Fast-moving products
- Reason code
Stockout rate should be viewed alongside available stock accuracy, replenishment and purchasing decisions.
Related guide: Stock Replenishment Best Practices for Fulfilment Teams.
10. Overselling Incidents
Overselling happens when the business accepts more orders than it can fulfil from available stock.
Overselling incidents are a practical signal that stock availability, allocation or channel synchronisation is not working properly.
Track overselling by:
- SKU
- Channel
- Warehouse
- Order source
- Stock sync delay
- Allocation failure
- Marketplace or ecommerce platform
- Customer impact
Overselling is often caused by using physical stock instead of available stock, delayed stock updates, weak allocation rules or returned stock being added back too early.
Read: How to Prevent Overselling Across Sales Channels.
11. Available Stock Accuracy
Available stock accuracy measures whether the stock shown as available is genuinely available for sale, allocation or fulfilment.
This is one of the most commercially important inventory accuracy metrics.
Available stock should exclude stock that is:
- Already allocated
- Damaged
- Quarantined
- Returned but not inspected
- Reserved for another customer
- In transit but not physically available
- Held for another channel
Poor available stock accuracy causes overselling, failed picks and customer promise failures.
12. Replenishment Accuracy
Replenishment accuracy measures whether pick faces are replenished correctly and on time.
Useful replenishment metrics include:
- Pick face stock accuracy
- Replenishment tasks completed on time
- Failed picks caused by empty pick faces
- Emergency replenishment requests
- Fast-moving SKUs below minimum quantity
- Incorrect replenishment location
Replenishment accuracy is important because pickers depend on the right stock being in the right pick location at the right time.
13. Returns Stock Accuracy
Returned stock can easily distort inventory if it is added back too early or handled inconsistently.
Returns stock accuracy measures whether returned goods are correctly received, inspected, graded and moved into the right stock status.
Track:
- Returned stock awaiting inspection
- Returned stock added back to available stock
- Returned stock quarantined
- Returned stock written off
- Returned stock sent for repair
- Return reason accuracy
- Time from return receipt to stock status decision
For wider returns guidance, read: Returns Management Best Practices.
14. Inventory Accuracy by SKU Velocity
Not all SKUs carry the same operational risk.
Fast-moving products should usually be checked more frequently because discrepancies affect more orders more quickly.
Measure accuracy separately for:
- Fast-moving SKUs
- Medium-moving SKUs
- Slow-moving SKUs
- Seasonal SKUs
- High-value SKUs
- Problem SKUs with repeated discrepancies
This helps teams focus counting and investigation effort where it matters most.
15. Inventory Accuracy by Location
Some locations may create more stock issues than others.
Measure inventory accuracy by:
- Warehouse zone
- Aisle
- Pick face
- Reserve location
- Goods-in area
- Returns area
- Quarantine area
- Temporary peak locations
This can reveal layout problems, labelling issues, congestion, poor putaway discipline or replenishment weaknesses.
Related guide: Warehouse Layout Optimisation for Faster Fulfilment.
Inventory Accuracy Metrics Example
| Metric | Example Value | What It Suggests |
|---|---|---|
| Inventory accuracy | 96.2% | Headline stock accuracy level |
| Location accuracy | 92.8% | Stock may exist but be hard to find |
| Failed pick rate | 3.1% | Stock trust is affecting picking |
| Stock adjustment value | £18,500/month | Financial impact of discrepancies |
| Overselling incidents | 42/month | Availability or sync issue |
| Emergency replenishments | 75/week | Pick face planning needs review |
This kind of view is much more useful than only reporting one headline inventory accuracy percentage.
Good vs Weak Inventory Accuracy Measurement
| Weak Measurement | Better Measurement |
|---|---|
| Only annual stock take variance | Regular cycle count accuracy by SKU, location and category |
| Only total stock value variance | Quantity, location, value and reason-code analysis |
| No failed pick tracking | Failed pick rate by SKU, location and cause |
| Manual adjustments without reason codes | Adjustment count and value by reason code |
| No returns stock visibility | Returned, quarantined, inspected and available stock tracked separately |
| All SKUs counted equally | Fast-moving, high-value and problem SKUs prioritised |
How Inventory Accuracy Affects Fulfilment Performance
Inventory accuracy has a direct impact on fulfilment performance.
Poor stock accuracy can reduce:
- Picking productivity
- Order accuracy
- On-time dispatch
- Perfect order rate
- Customer trust
- Warehouse confidence
- Sales channel reliability
It can also increase:
- Backlog
- Overselling
- Manual checks
- Emergency replenishment
- Customer service workload
- Fulfilment cost per order
- Returns and replacement shipments
Inventory accuracy is therefore not just an inventory team issue. It is a fulfilment performance issue.
How to Improve Inventory Accuracy Metrics
Improving inventory accuracy starts with better process control and better visibility.
Practical improvements include:
- Use barcode scanning for receiving, putaway, picking and stock movement
- Control stock movements between locations
- Use clear bin and location labelling
- Separate available, allocated, damaged, returned and quarantined stock
- Cycle count fast-moving and high-risk SKUs regularly
- Track failed picks and investigate root causes
- Use reason codes for adjustments
- Improve replenishment triggers
- Process returns before adding stock back to availability
- Review overselling incidents by channel and SKU
For a practical stock control guide, read: Inventory Accuracy: Why It Breaks and How to Fix It.
Inventory Accuracy and Peak Season
Peak season increases inventory accuracy risk because stock moves faster, temporary staff may be involved, replenishment pressure increases and sales channels compete for the same inventory.
Before peak, review:
- Fast-moving SKU accuracy
- Pick face quantities
- Stock buffers
- Returns stock rules
- Cycle count priorities
- Overselling risk products
- Marketplace stock sync rules
- Temporary stock locations
During peak, inventory accuracy issues should be treated as fulfilment risk, not admin clean-up.
Related guide: How to Manage Peak Season Fulfilment.
Inventory Accuracy Improvement Checklist
| Area | Action |
|---|---|
| Headline accuracy | Track inventory accuracy percentage, but do not rely on it alone |
| Location accuracy | Measure whether stock is in the correct warehouse location |
| Failed picks | Track failed pick rate by SKU, location and reason |
| Cycle counts | Measure variance by SKU, category, location and value |
| Adjustments | Use reason codes and track adjustment count and value |
| Availability | Separate available stock from allocated, damaged, returned and quarantined stock |
| Overselling | Track overselling incidents by channel, SKU and cause |
| Returns | Do not add returned stock back to availability before inspection |
How Inventory Accuracy Metrics Connect to Other Metrics
Inventory accuracy connects directly to several other fulfilment metrics.
- Pick rate and pick accuracy — poor stock accuracy causes failed picks and wrong picks
- Warehouse productivity metrics — stock issues waste labour time
- Order accuracy rate — stock errors can lead to incorrect fulfilment
- On-time dispatch rate — failed picks delay dispatch
- Backlog metrics — stock-related issues create delayed orders
- Perfect order rate — stock failures affect the full customer promise
- Fulfilment cost per order — stock errors create rework and customer service cost
- Returns metrics — returned stock can damage accuracy if not controlled
This is why inventory accuracy should be visible in the fulfilment dashboard, not hidden in periodic stock reports.
How Technology Helps Improve Inventory Accuracy
Technology helps inventory accuracy by recording stock movement at the point activity happens and giving teams clearer visibility of stock status.
A fulfilment platform can support:
- Barcode scanning
- Location validation
- Goods-in control
- Putaway workflows
- Stock movement tracking
- Pick face replenishment
- Cycle counting
- Failed pick reporting
- Stock adjustment reason codes
- Returns stock status control
- Available stock visibility
- Multi-channel stock synchronisation
For a broader guide, read: What is Fulfilment Automation?.
How Modulus365 Helps Improve Inventory Accuracy
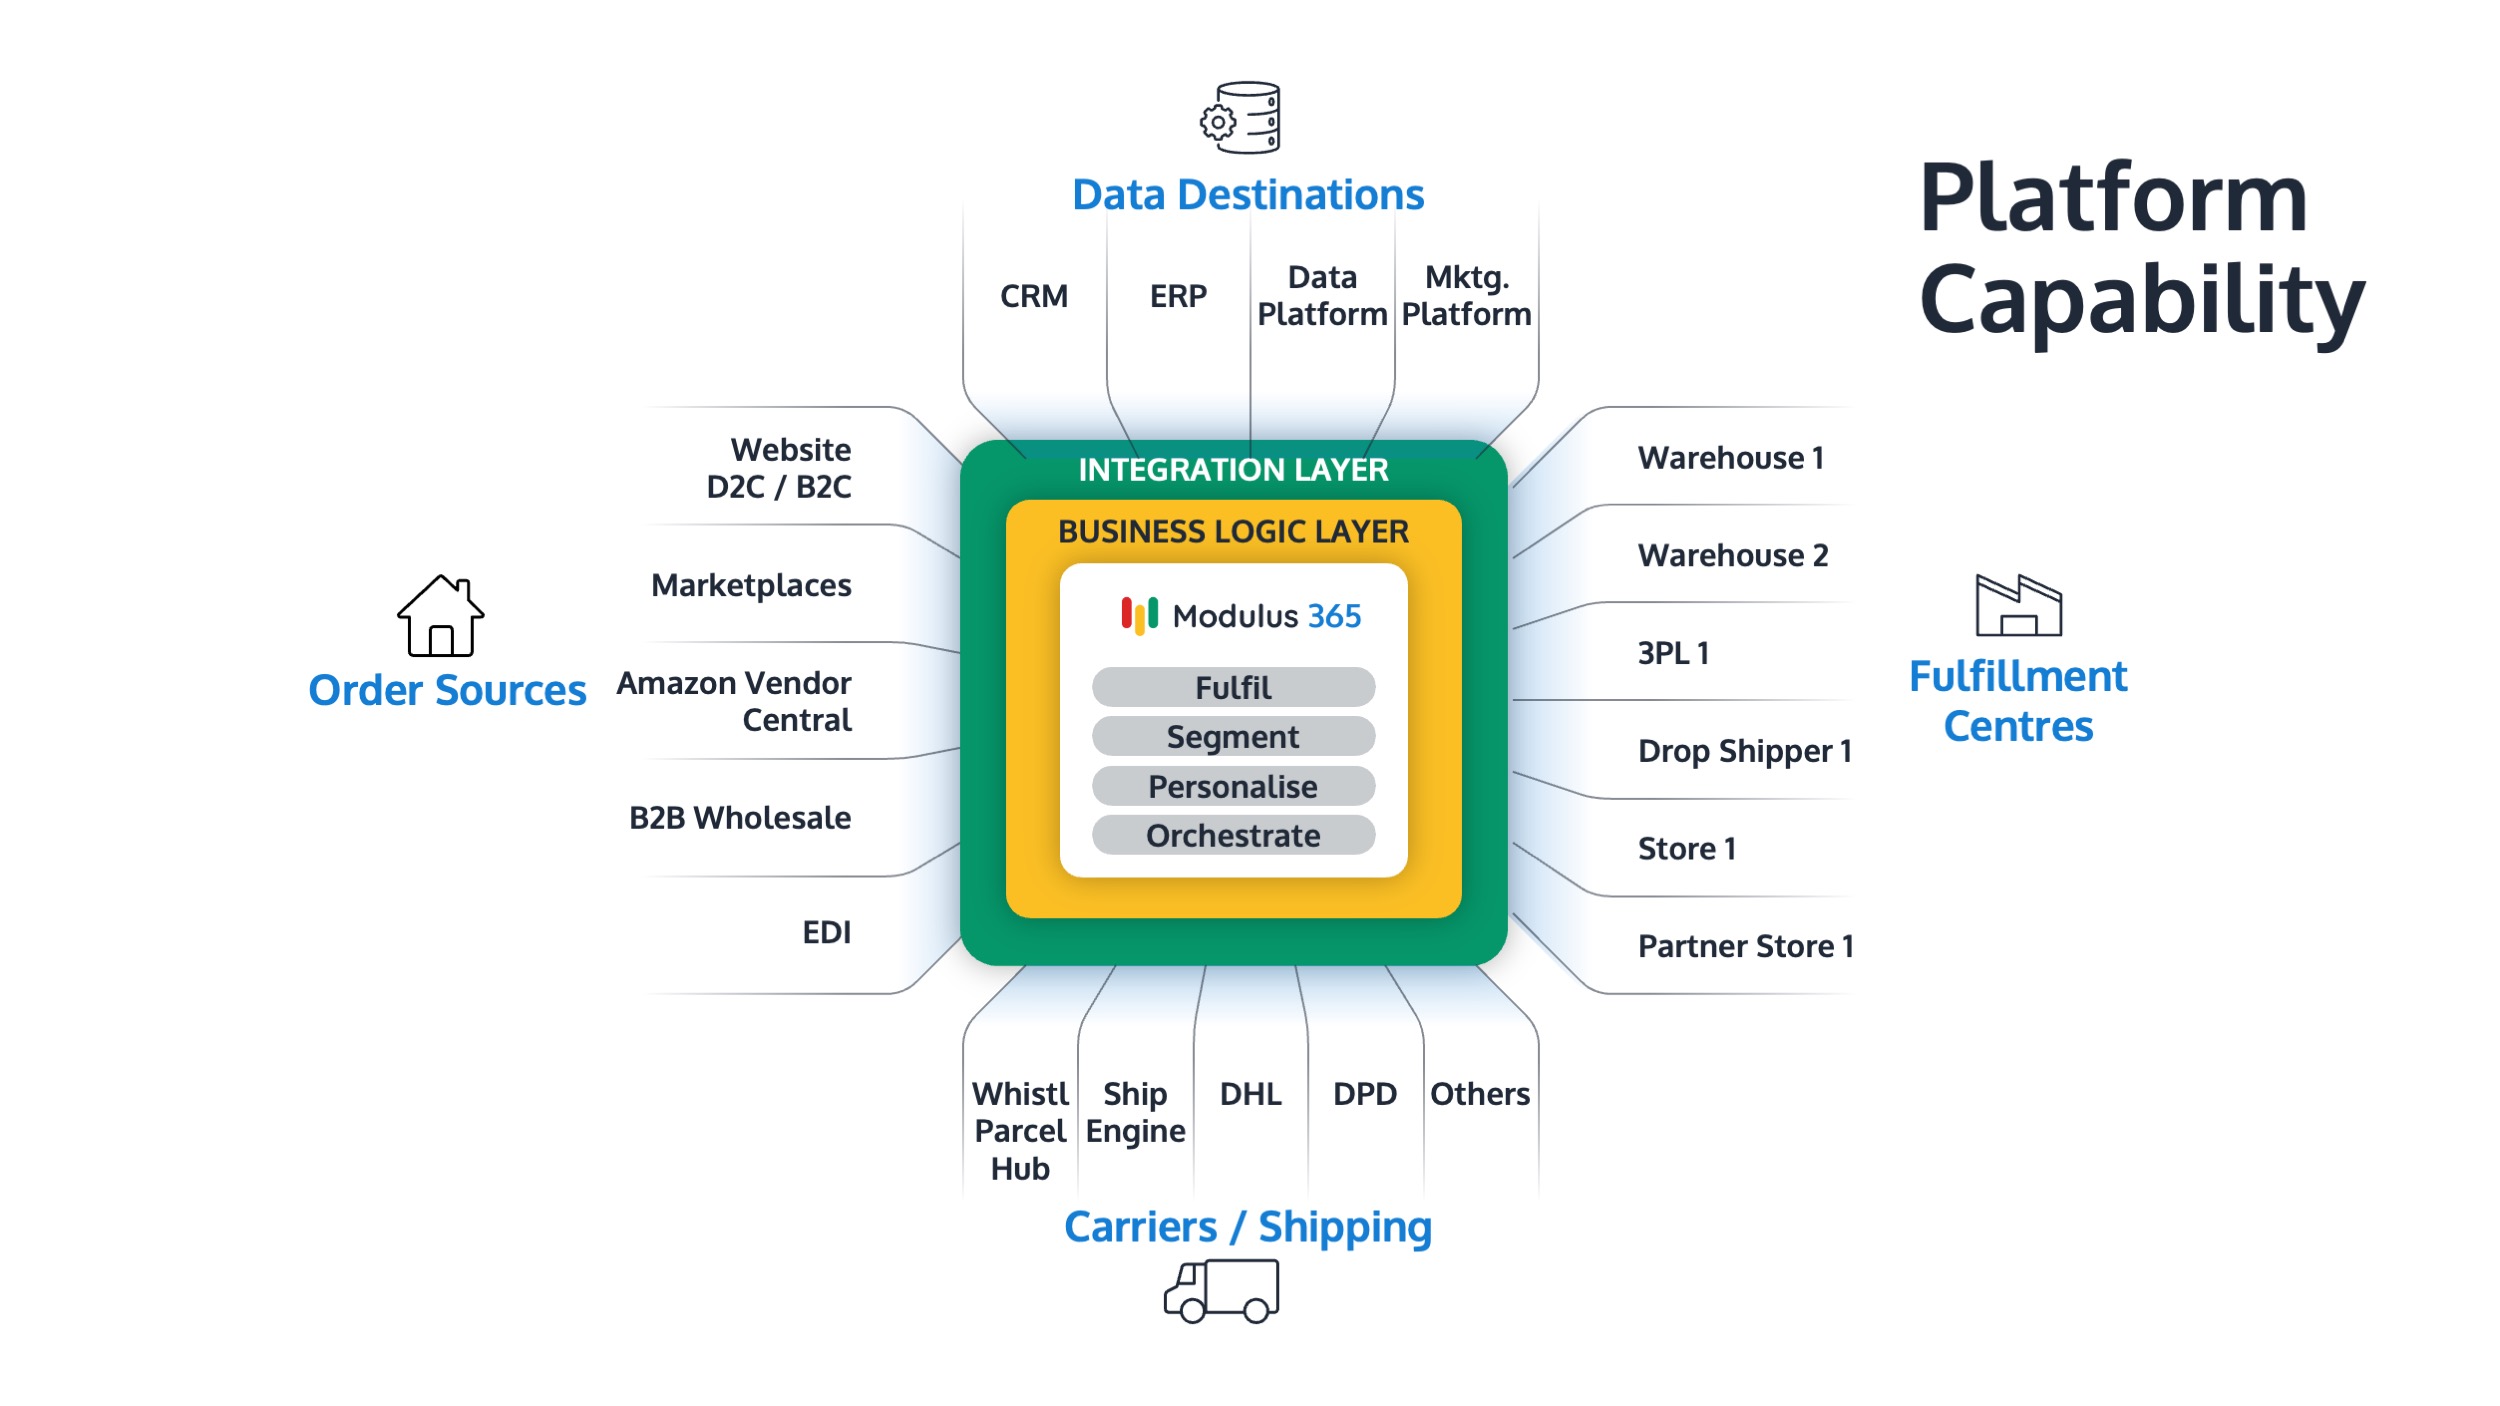
Modulus365 helps businesses connect order management, warehouse workflows, barcode scanning, inventory visibility, stock allocation, replenishment, returns and fulfilment reporting.
By giving operations teams better visibility of physical stock, available stock, allocated stock, warehouse locations and stock movement, Modulus365 helps businesses improve stock trust and reduce fulfilment errors caused by poor inventory accuracy.
For Sage businesses, Modulus365 can work alongside the ERP as the fulfilment operations layer.
👉 Learn more about Modulus365 for Sage.
Related FOA Guides
Inventory accuracy metrics help fulfilment teams understand whether stock can be trusted for allocation, picking, replenishment and customer promises. These guides explain the connected stock-control topics:
- Inventory Accuracy: Why It Breaks and How to Fix It
- Available Stock vs Physical Stock vs Allocated Stock
- Cycle Counting vs Annual Stock Takes
- How to Prevent Overselling Across Sales Channels
- Stock Replenishment Best Practices for Fulfilment Teams
- Backlog Metrics: How to Measure Fulfilment Risk Before Customers Complain
- Pick Rate vs Pick Accuracy: Why Speed Alone Is a Dangerous KPI
- Barcode Scanning in Warehouse Operations
Ready to Improve Inventory Accuracy?
If stock discrepancies, failed picks, overselling, manual adjustments or poor stock visibility are affecting fulfilment performance, Modulus365 can help bring better inventory control into your operation.
Frequently Asked Questions
What are inventory accuracy metrics?
Inventory accuracy metrics measure how closely system stock records match physical stock reality, including quantities, locations, availability, adjustments and discrepancies.
How do you calculate inventory accuracy?
Inventory accuracy is usually calculated by dividing accurate stock records by total stock records checked, then multiplying by 100.
What inventory accuracy metrics should fulfilment teams track?
Fulfilment teams should track inventory accuracy percentage, quantity accuracy, location accuracy, failed pick rate, cycle count variance, stock adjustment rate, stock adjustment value, overselling incidents and available stock accuracy.
Why does inventory accuracy matter for fulfilment?
Inventory accuracy matters because poor stock data causes failed picks, overselling, dispatch delays, stockouts, manual checks, customer service issues and higher fulfilment cost.
How can businesses improve inventory accuracy?
Businesses can improve inventory accuracy by using barcode scanning, cycle counting, controlled stock movements, clear location labelling, stock status separation, adjustment reason codes and better returns processing.